Educational Resources
Ontario-based lesson plans give you the knowledge to meet curriculum standards and make biodiversity relevant to your students.
|
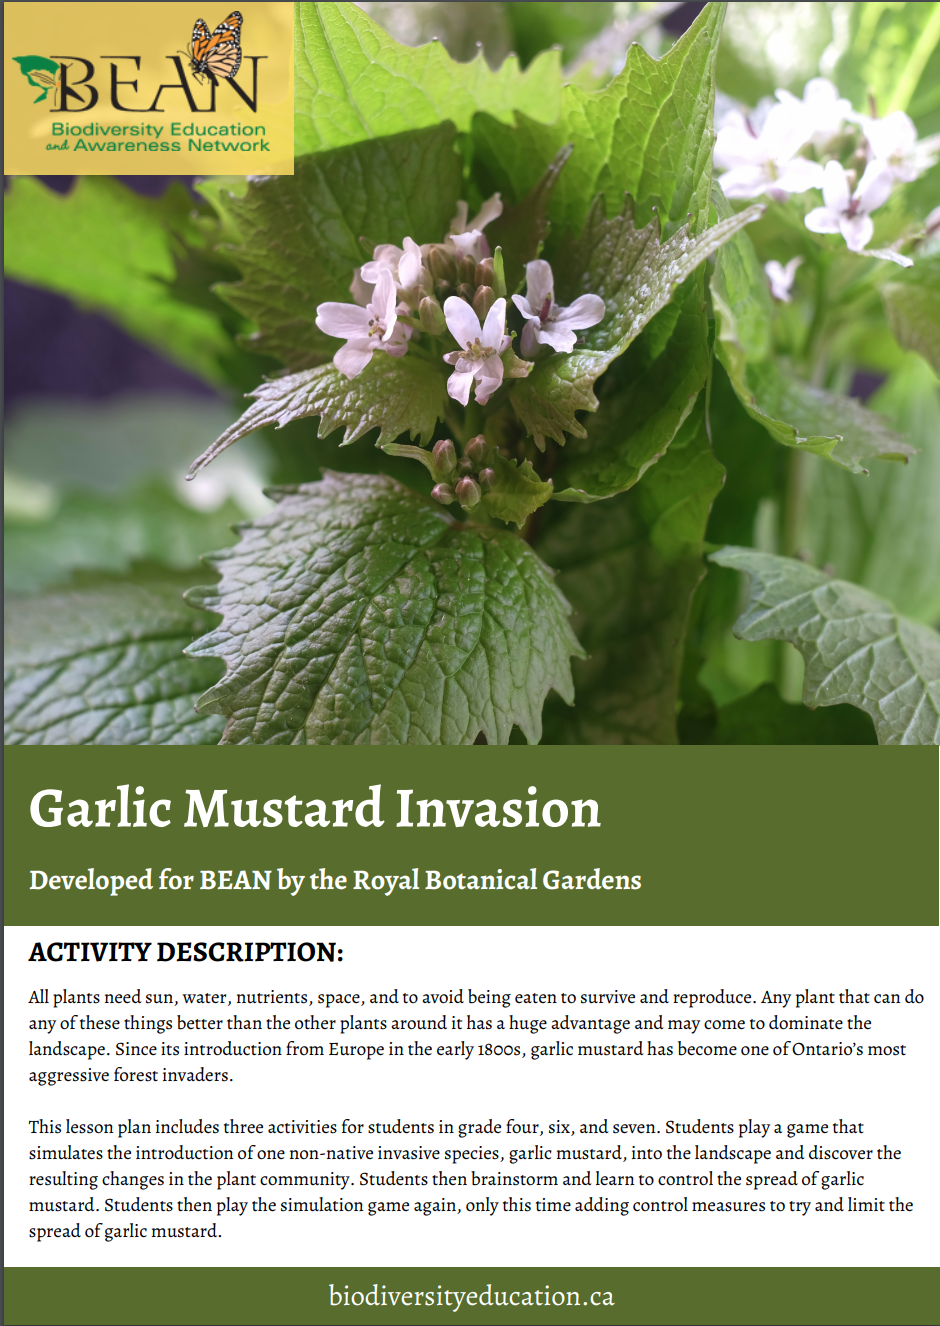
Garlic Mustard InvasionAll plants need sun, water, nutrients, space, and to avoid being eaten to survive and reproduce. Any plant that can do any of these things better than the other plants around it has a huge advantage and may come to dominate the landscape. Since its introduction from Europe in the early 1800s, garlic mustard has become one of Ontario’s most
aggressive forest invaders. Grade: 4 Habitats and Communities, 6 Biodiversity, 7 Interactions in the Environment Curriculum Links: Grade 4 (1.2, 3.3), Grade 6 (3.5, 3.7), Grade 7 (3.2, 3.3, 3.4) Key Words: garlic mustard, invasive species, sun, water, nutrients, exponential growth Musical Mussels: Invasive Species Simulation Game
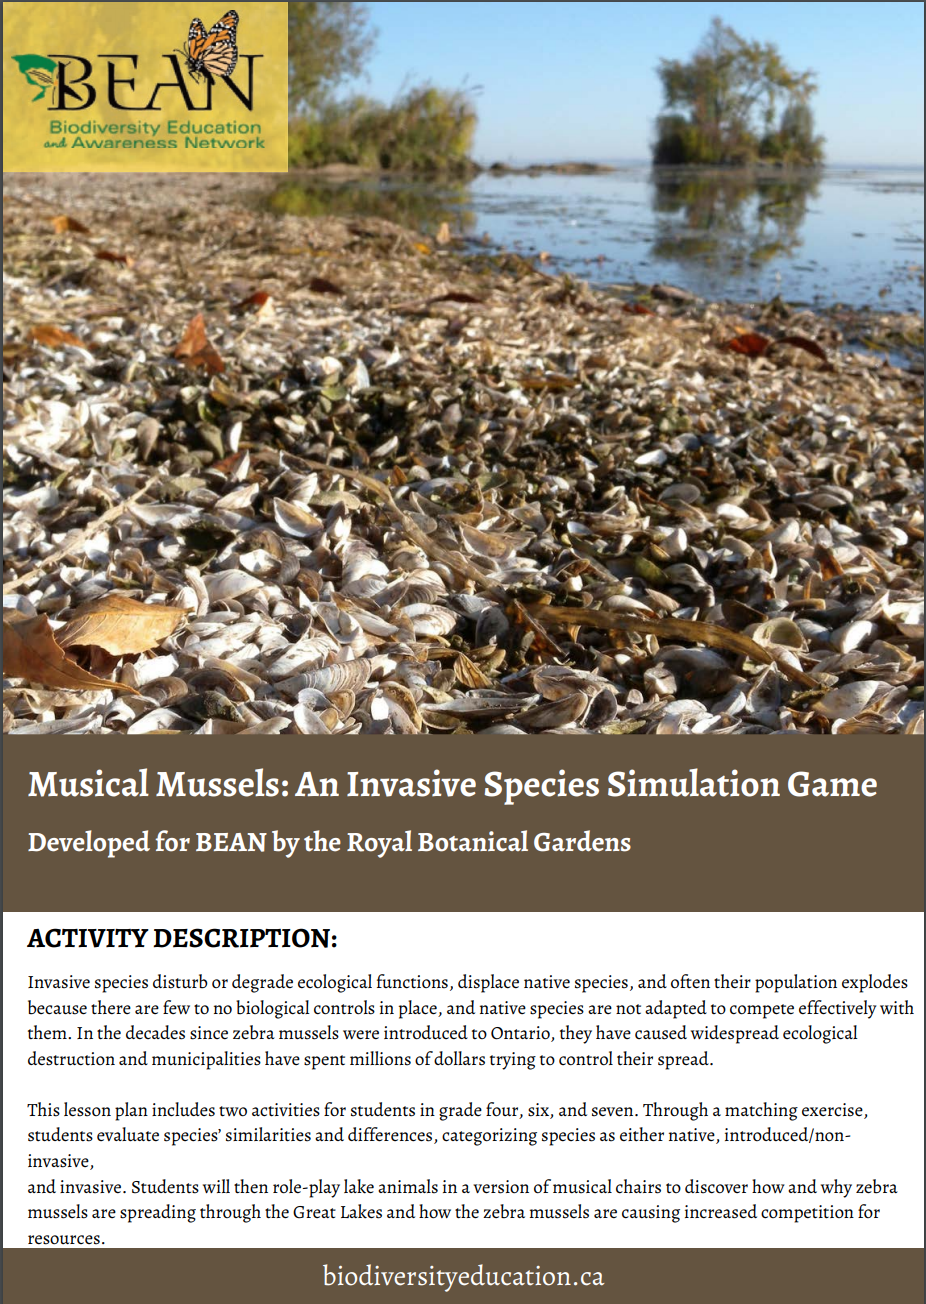
Invasive species disturb or degrade ecological functions, displace native species, and often their population explodes because there are few to no biological controls in place, and native species are not adapted to compete effectively with them. In the decades since zebra mussels were introduced to Ontario, they have caused widespread ecological destruction and municipalities have spent millions of dollars trying to control their spread.
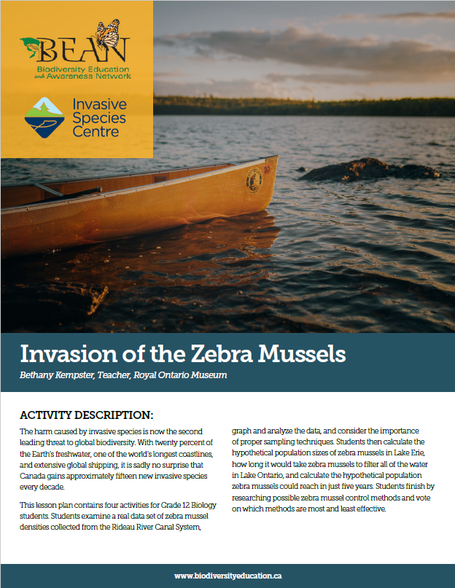
Grade: 4 Habitats and Communities, 6 Biodiversity, 7 Interactions in the Environment Curriculum Links: Grade 4 (1.2, 3.3), Grade 6 (3.5, 3.7), Grade 7 (3.2, 3.3) Key Words: native mussels, zebra mussels, invasive characteristics, biodiversity Invasion of the Zebra MusselsThe harm caused by invasive species is now the second leading threat to global biodiversity. Students will examine and analyze a real data set of zebra mussel densities, calculate hypothetical growth and filtration rates, and research control methods.
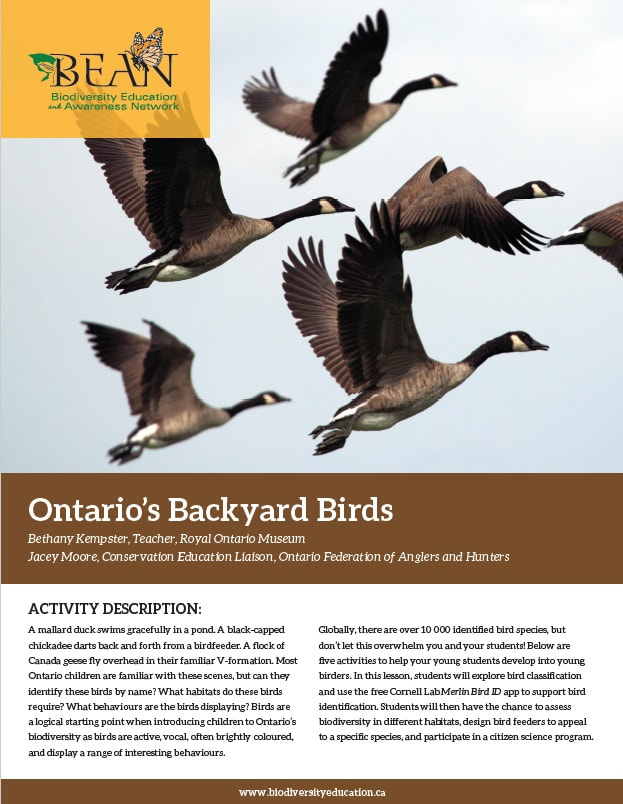
Grade: 12 Biology, Population Dynamics Curriculum Links: F2.2, F3.3, F3.5 Key Words: zebra mussels, exponential growth, carrying capacity, population models Ontario's Backyard BirdsBirds are a logical starting point when introducing children to Ontario’s biodiversity. In this activity: students explore bird classification, use the free Cornell Lab Merlin Bird ID app, assess biodiversity in different habitats, design bird feeders to appeal to a specific species, and participate in a citizen science program.
Grades: 4 Habitats and Communities, 6 Biodiversity Curriculum Links: Grade 4 (1.1, 3.7), Grade 6 (2.2, 3.1) Key Words: bird, classification, habitats, biodiversity, citizen science, community science technology What Size Footprint Are You Leaving on the Earth?A typical Canadian’s resource consumption is far above what the Earth can sustain. In this activity: students calculate their ecological footprint, explore their data and compare it to the class average, examine the importance of metaphors, and hold a class debate on issues of responsibility and sustainability.
Grade: 9 Issues in Canadian Geography Curriculum Links: Academic (C1.4), Applied (A1.4, E1.1) Key Words: ecological footprint, sustainability, biocapacity, responsibility, debate |
|
Let's ID That Tree!
Ontario is a province with approximately 85 billion individual trees representing over 140 species. In this activity: students explore tree anatomy and classification and use the free Pl@ntNet, assess native and non-native trees in their local community, and plant some native trees.
Grades: 3 Growth and Change in Plants, 4 Habitats and Communities Curriculum Links: Grade 3 (1.1, 2.2, 3.6), Grade 4 (1.1, 3.1) Key Words: tree, diversity, classification, technology, native vs non-native species Watersheds: We Are All Connected
Bounded by three oceans, Canada has the longest ocean coastline in the world. In this activity: students create a model watershed and discover how activities at one location impact areas downstream, experiment with cleaning up contaminated water, and explore local initiatives to reduce water pollution entering their watershed.
Grades: 6 Biodiversity, 7 Interactions in the Environment, 8 Water Systems Curriculum Links: Grade 6 (1.1), Grade 7 (3.8), Grade 8 (2.2, 2.4, 3.2) Keywords: Watershed, Ocean, Point source, Non-point source, Pollution, Contamination |
|
Big Shark, Big Loss, Big Impact
Large predatory fish populations have plummeted over 90% in the last decade. In this activity: students simulate marine food webs and discover what happens when humans reduce the shark population. Through collecting, analyzing, and graphing the data, students will explore the role of sharks and humans in maintaining ocean food webs.
Grades: 4 Habitats and Communities, 4 Data Literacy, 6 Biodiversity, 6 Data Literacy, 7 Interactions in the Environment, 7 Data Literacy Curriculum Links: Grade 4 science (1.1, 1.2, 2.2, 3.6) Grade 4 math (D1.3), Grade 6 science (3.4, 3.5), Grade 6 math (D1.3), Grade 7 science (3.4, 3.5, 3.7), Grade 7 math (D1.3) Keywords: food chain, simulation game, graphing, data analysis, sustainability |
|
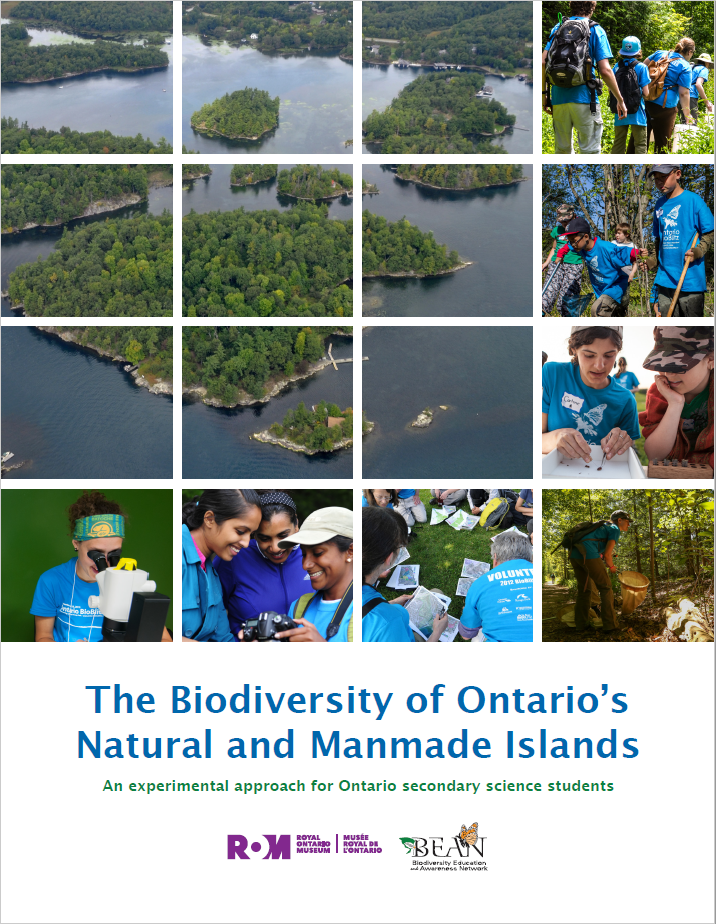
The Biodiversity of Ontario's Natural & Manmade Islands
While island biodiversity might invoke images of tropical locales the principles of island biodiversity are as relevant here in Ontario as well! After all the Great Lakes are home to more than 35 000 islands and habitat fragmentation has divided our natural landscape. This kit contains 3 high school level lesson plans to further explore concepts related to island biodiversity.
Grades: 9 Science, 11 Biology, 11 Environmental Science, 12 Biology Curriculum Links: See individual lesson plans for specific curriculum links |
|
The Power Of PlantsPlants form the foundation of our ecosystems. This plant-rooted program contains 6 distinct activities. Students will have the chance to exercise their creativity through botanical drawing and creating a classroom herbarium by pressing and preserving plant specimens. They will learn about plant journeys: from farm to table, and seed dispersal. Finally, they will get to know trees, inside and out, from species identification to age rings.
Grades: 3, 4, 5 & 6 Curriculum Links: See individual lesson plans for specific curriculum links |
